
The same crowd-positioning signal said fade on ETH, follow on SOL and ignore on BTC in 2026. Why an aggregate cannot tell you whether the crowd is early or late.

Centaur · Research
October 28, 2026 · 5 min read

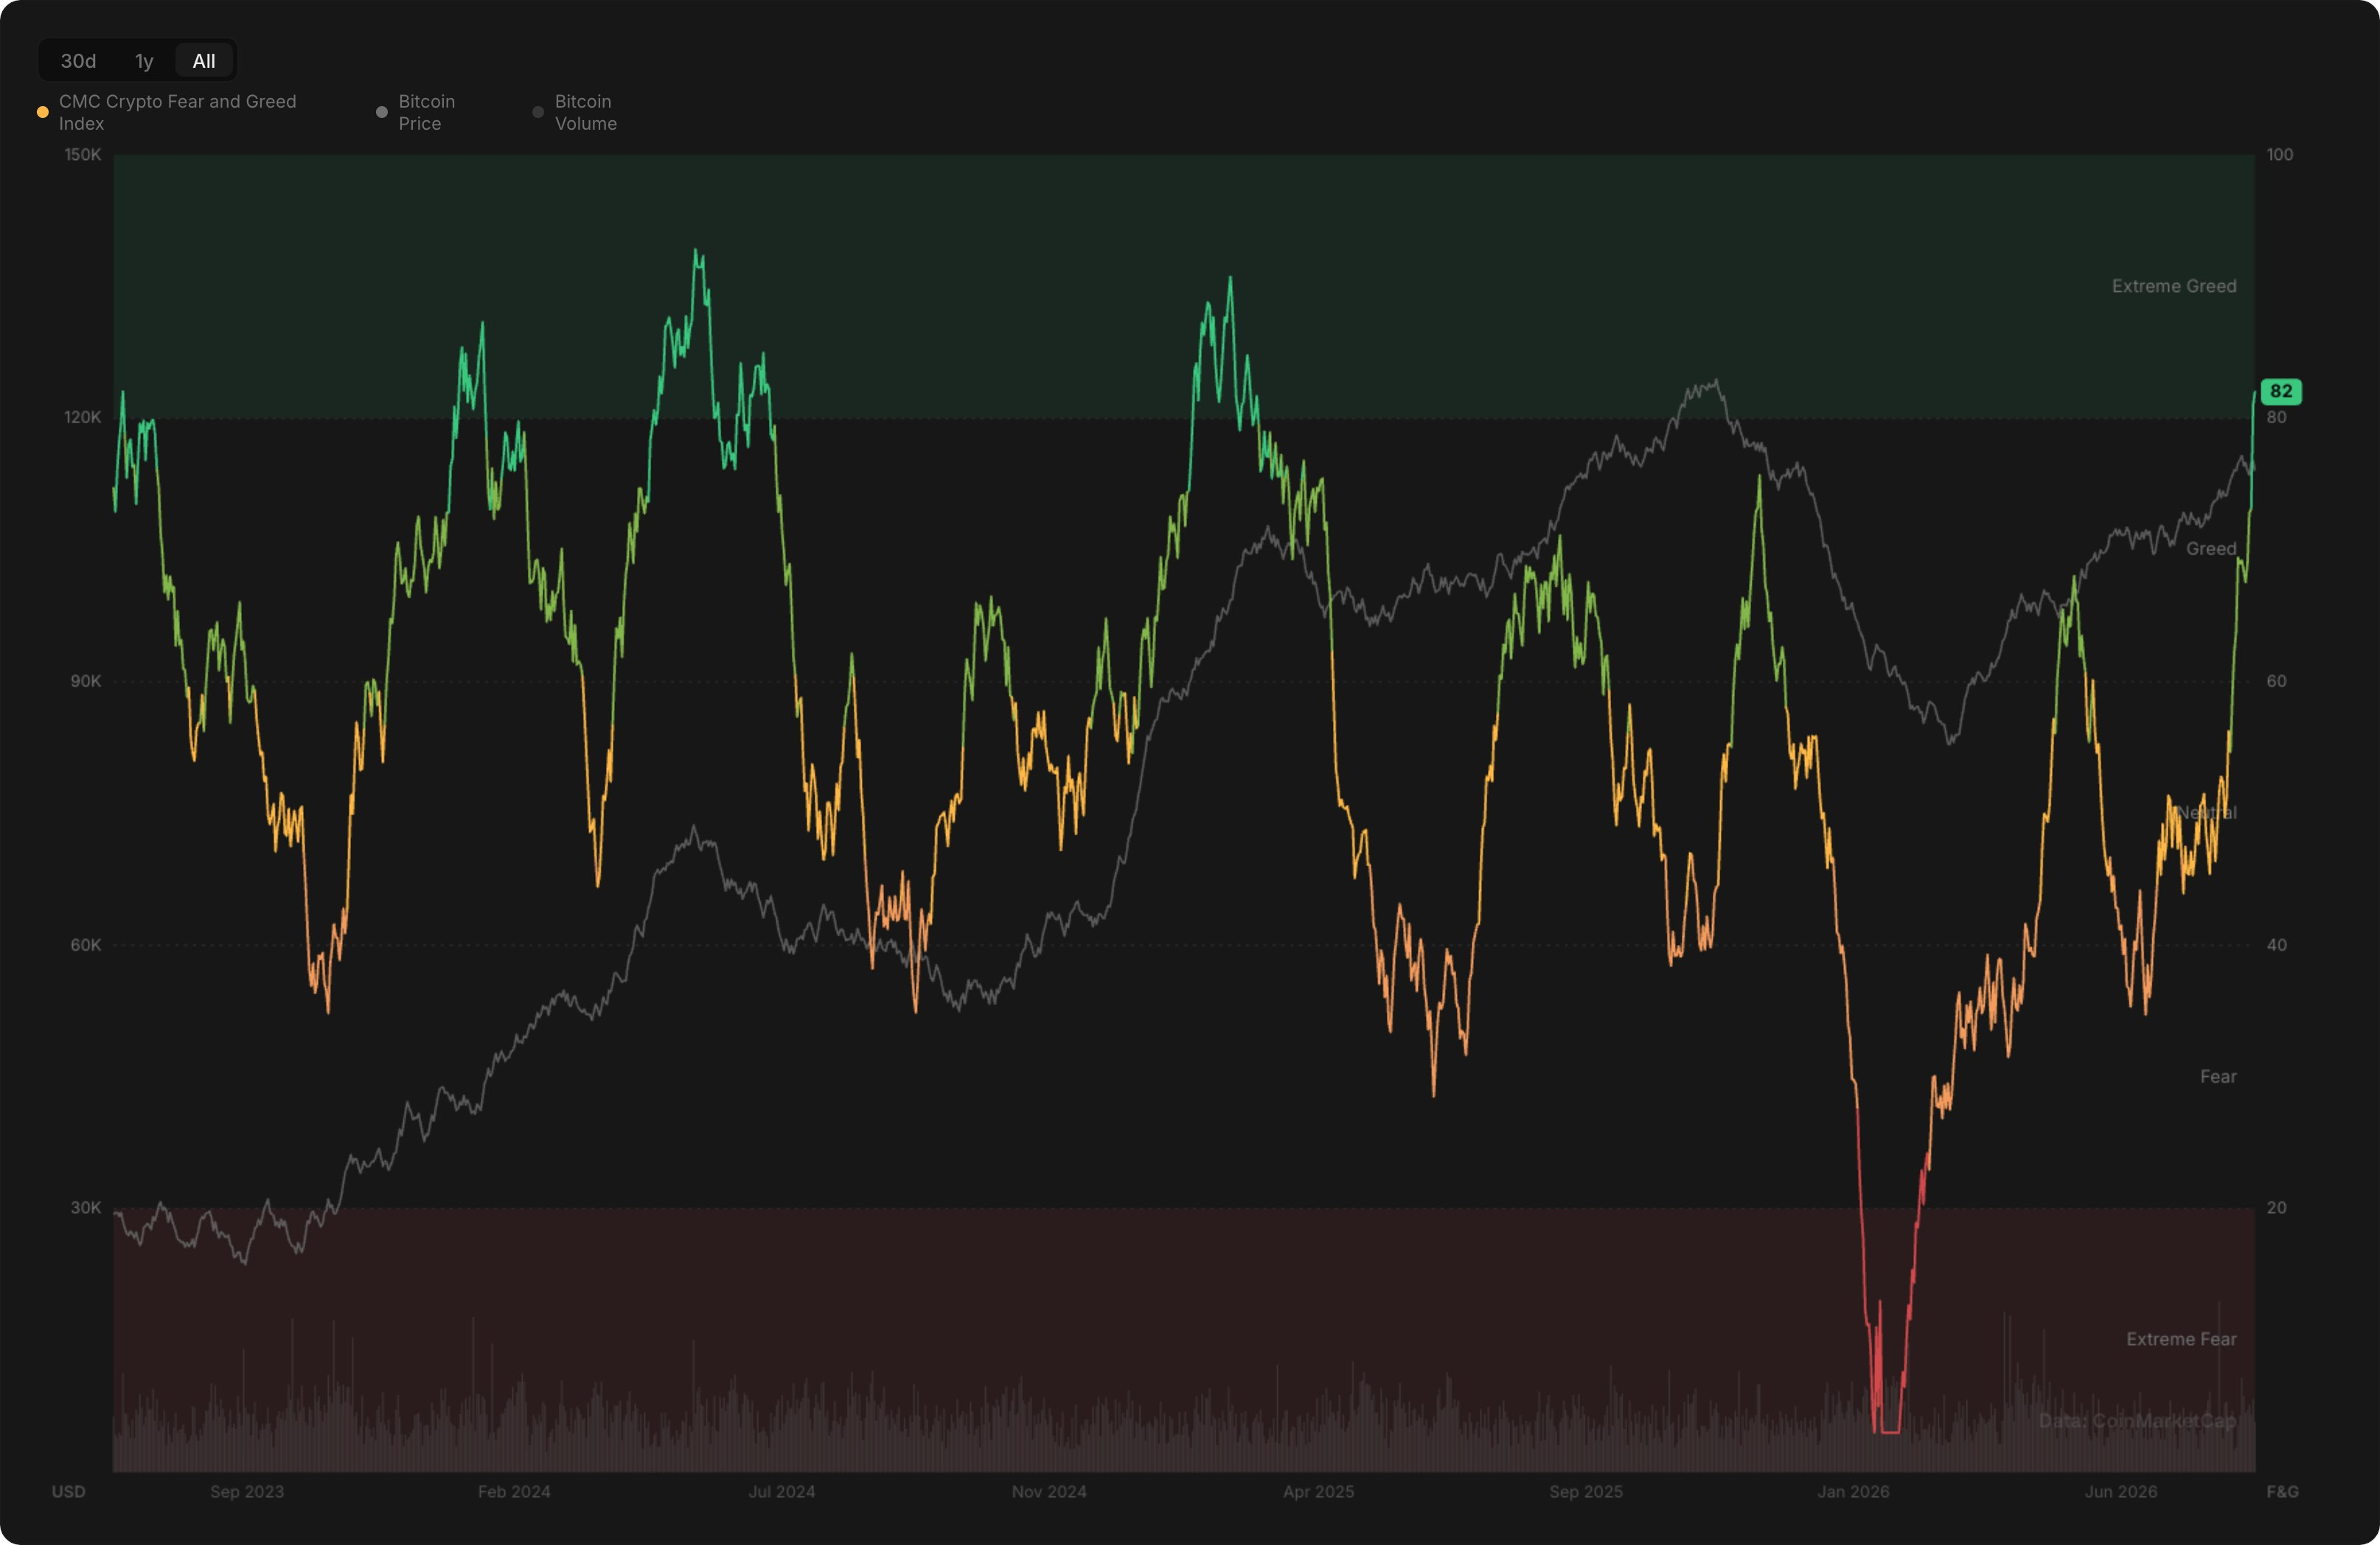
The CMC Fear and Greed Index vs. Bitcoin, 2023 to 2026. In late August 2026 the index printed 82, extreme greed, its highest reading of the year, six months after bottoming at 5.
In late August 2026, the CMC Fear and Greed Index printed 82 (the all-time high is 92, back in March 2024), denoting extreme greed, its highest reading of the year, barely six months after bottoming at 5. Around the same time, Cambrian ran about 2,500 ETH posts on X through one question: do bullish posts carry directional value? 84% of the historical posts were bullish. Yet their directional accuracy 24 hours, 7 days and 30 days later was almost exactly a coin flip: 47.5%, 47.4% and 50.4%. In fact, average returns were negative over these horizons.
Most traders incorporate sentiment and positioning in their process: long/short ratios, funding, fear and greed indices, the vibes on the timeline. The assumption is that market positioning can be interpreted consistently, either as a momentum signal or as a contrarian one.
Centaur put this question to the test on its own data, as a way to show the issues with aggregate sentiment and positioning signals. It took every position opened by its tracked traders across the three majors, BTC, ETH and SOL, from February to August 2026, and plotted the same indicator on every chart: the share of traders opening longs each week, mapped against price.

Share of tracked traders opening longs each week. BTC, ETH and SOL, February to August 2026.
The same indicator meant something different on all three charts.
Sometimes it is a contrarian cue. ETH traders' positioning hit its two most bearish readings of the year, 9% long in mid-March and 20% long in late June, almost exactly at the two best buying moments of the year. A 12% rally followed the first within weeks; a 14% bounce off the yearly low followed the second. One should have faded the crowd.
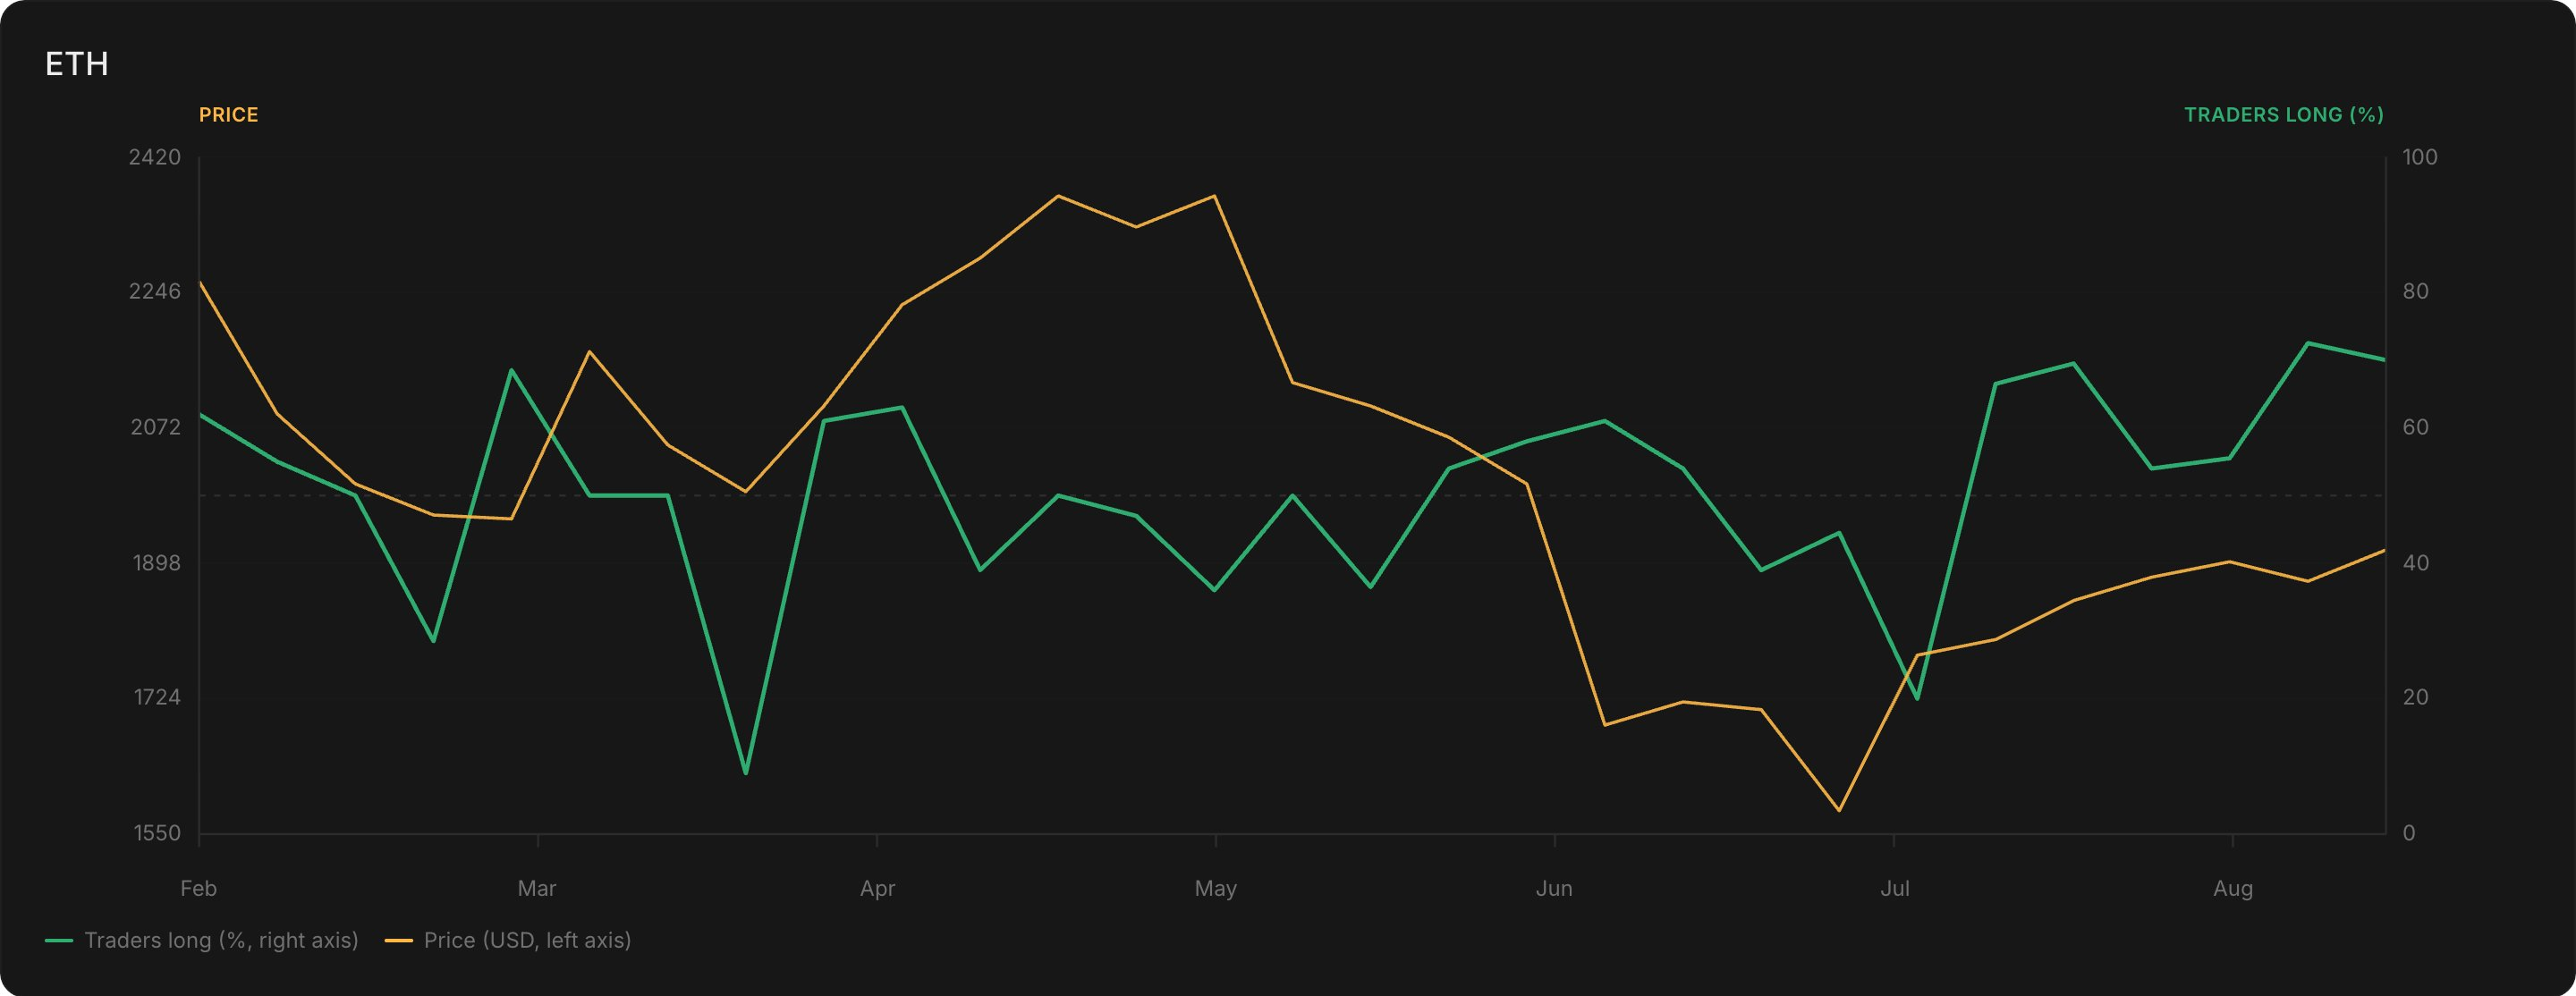
ETH's crowd at its two most bearish, 9% long in mid-March and 20% long in late June, marked the two best entries of the year.
Sometimes it is a timing signal worth following. SOL's positioning got it right twice in a row: it de-risked ahead of the late-May flush, cutting to about 35% long as price broke down, then flipped long off the low and ran 80% to 90% long through the roughly 24% recovery that followed. Same methodology as ETH, arriving at the opposite conclusion.
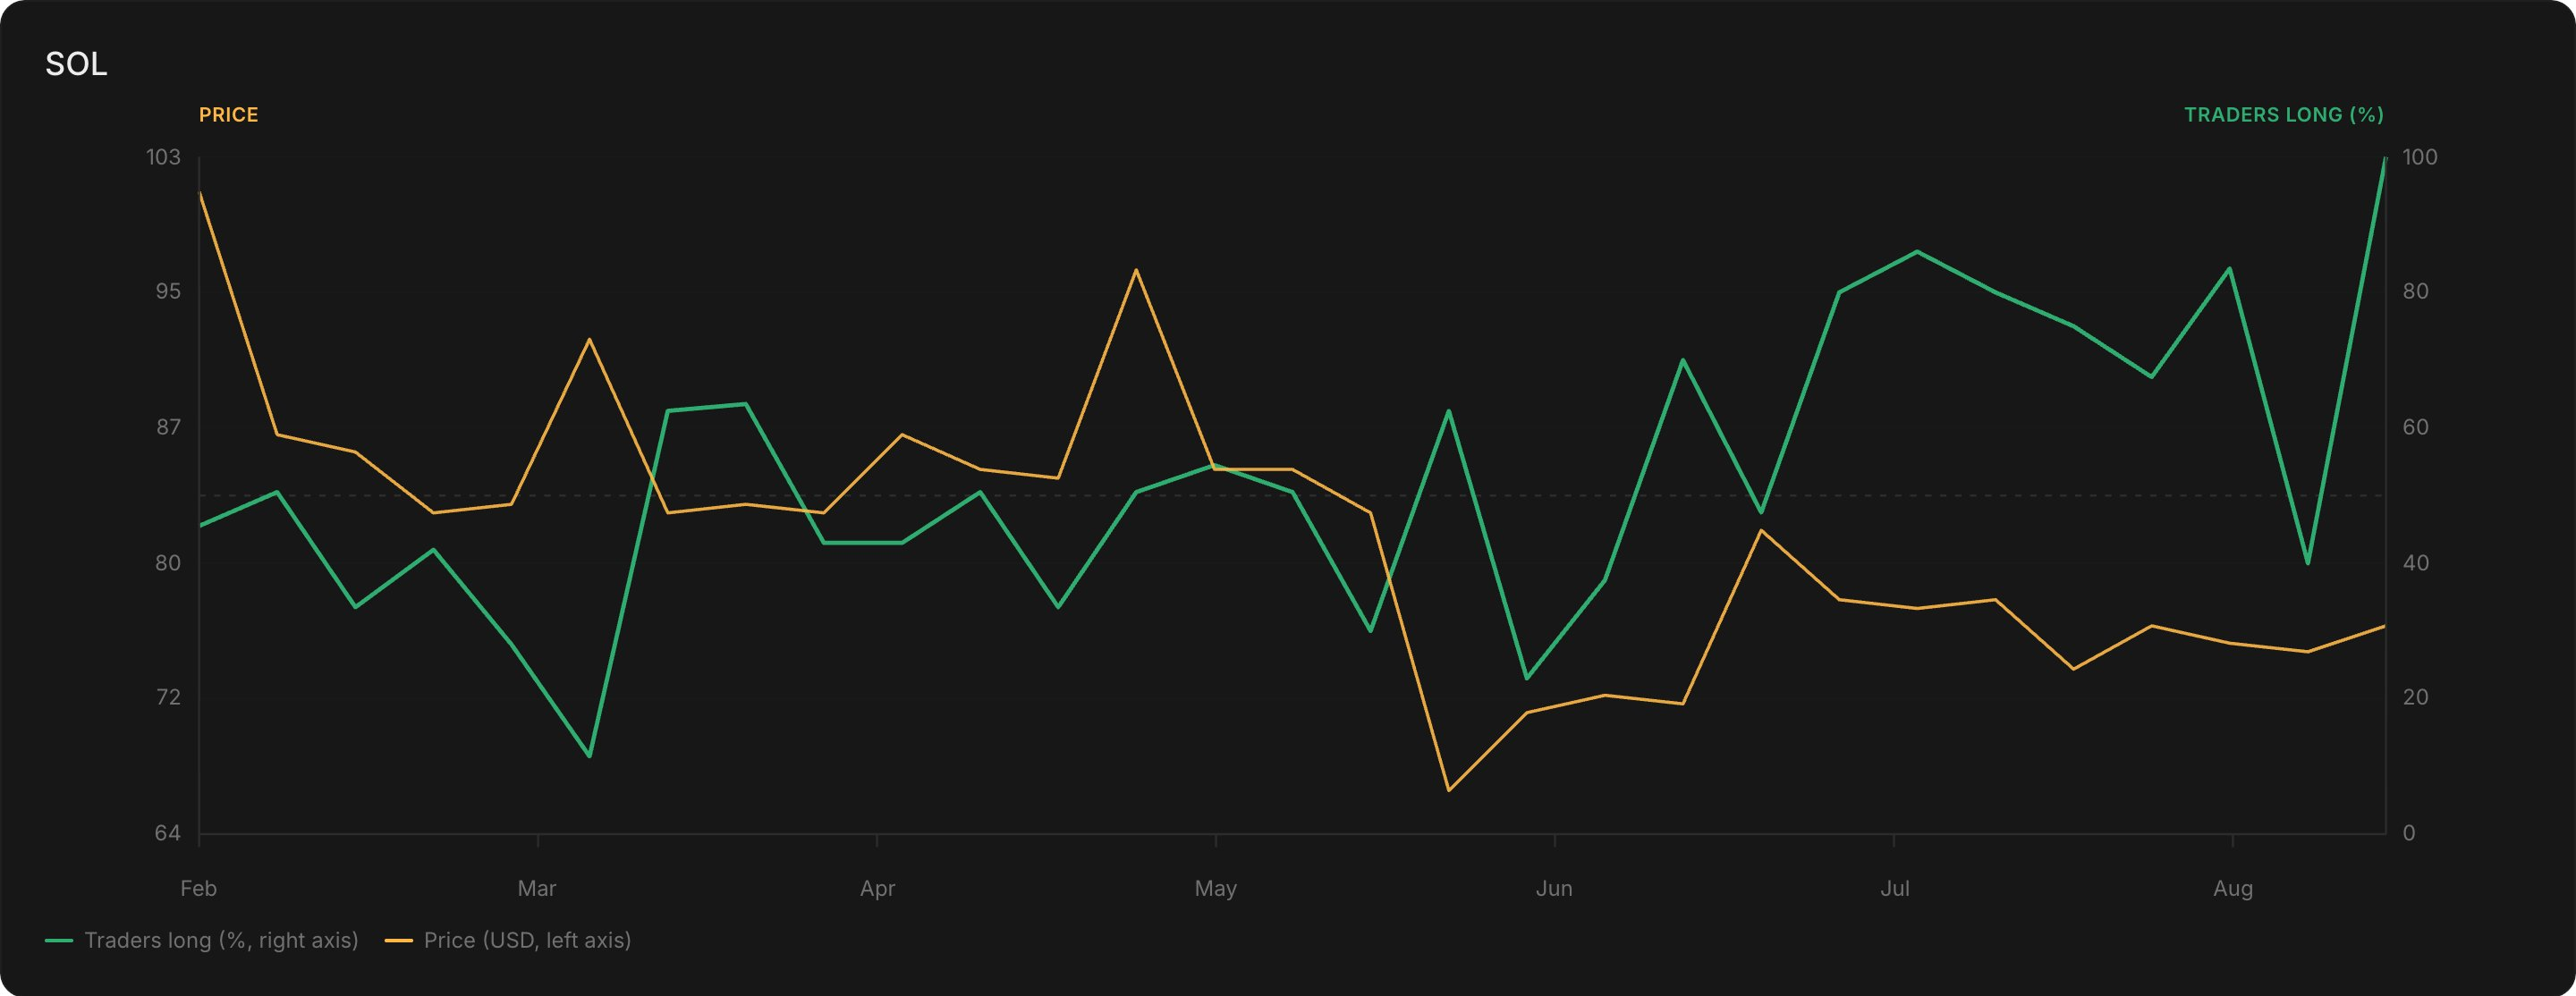
SOL's crowd cut to about 35% long ahead of the late-May flush, then ran 80% to 90% long through the recovery off the $66 low.
And sometimes it is neither. BTC's positioning was pinned between 50% and 65% long the entire period, through a 28% drawdown from the April top and through the recovery alike. No signal either way.

BTC's crowd sat pinned at 50% to 65% long through a 28% drawdown and the recovery alike.
So across three assets, the same signal gave three different readings: fade (ETH), follow (SOL), ignore (BTC). That is the problem with sentiment and positioning analytics, and with aggregated signals in general. The market can be early, late, or exactly on time.
This is not unique to Centaur's data. The literature has been running this experiment for decades, and the results align:
Traders staring at sentiment and market positioning share the same question, and a headline number alone cannot answer it. What answers this eternal question is the composition of the number. A reading built from traders who front-run moves means the opposite of the same reading built from traders who chase them.
That is what Centaur is building: the ability to double-click on any aggregate and see the theses and track records of the world's best traders.

